Case Studies
Real-world examples and statistics: How thermal network operators are improving the performance of their networks with Dyneo.
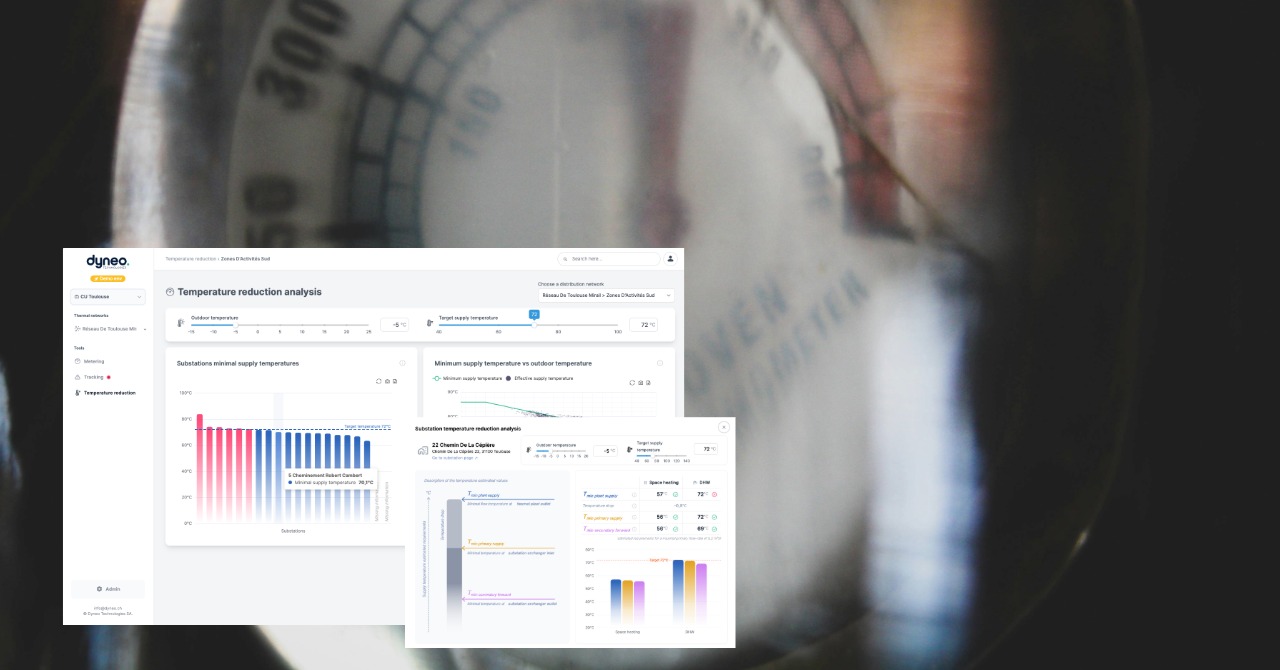
Our client needs to lower the temperature of its district heating network to integrate new renewable energy sources (heat pumps, waste heat, solar thermal). In just four weeks, Dyneo connected dozens of substations and provided the necessary analyses to manage this temperature reduction without replacing the heat exchangers, resulting in significant cost savings.

In a district heating network comprising several dozen substations, a small number of improperly adjusted delivery points were reducing the overall efficiency of the system. Dyneo made it possible to automatically identify these critical substations and prioritize corrective actions. The result: a reduction of up to 15 °C in the most problematic return flows, and an overall reduction of 5 to 10 °C in the network’s return temperature.
They operate their networks using Dyneo


